Data Understanding and Preprocessing
Category > Data Exploration
Sat 03 September 2022Data Understanding and Preprocessing
Welcome to the second tutorial video of the AI starterkit on data exploration. In this video, we will introduce the data that will be used throughout the tutorial and explain how to preprocess your data before you can start with the statistical exploration.
Throughout the tutorial, we will explore the datasets shared by Pronto, Seattle’s bike sharing system. On the one hand, Pronto provides information about the single stations where you can take a bike. On the other hand, information about the single trips themselves are shared in an anonymized way. While we will have a brief look at the location data, the focus in this tutorial is on the trip data.
Now, let’s have a look at the data sets.
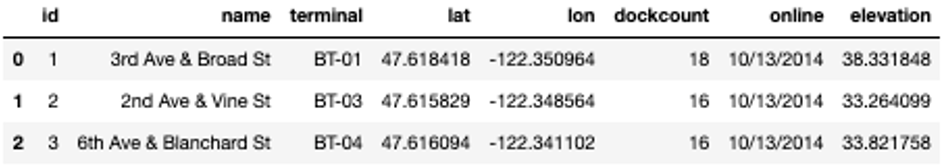
We can see, that - besides the pure geolocation data given by latitude and longitude – quite some information is shared about the single stations. Each station can be uniquely identified either by its id, its name, defined by the street intersection where the station is located and more technically, by its terminal name. We also have details on the size of the station, given by the number of docks available and when the station was put in service, given by the variable “online”. Finally, we also know about the station’s elevation from sea level.
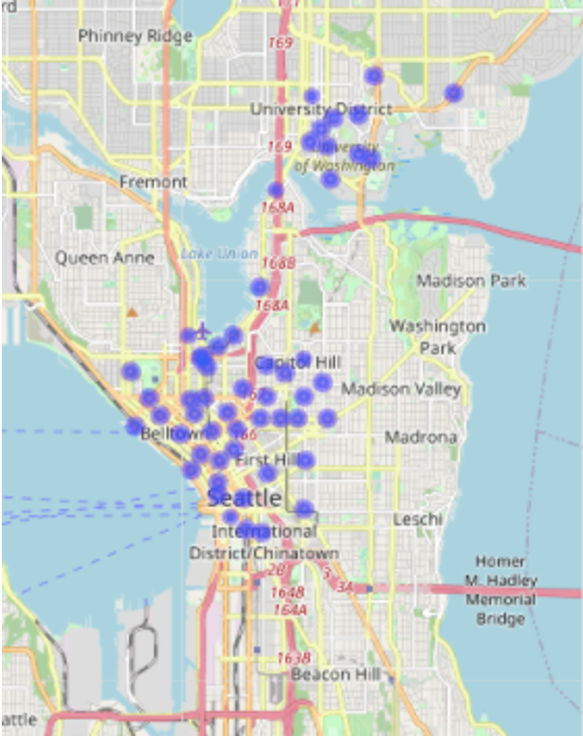
With the geo-coordinates given, we can put the single stations on a map - probably the easiest way for humans to understand where the stations are located. From the map, we deduct that - location-wise - there are two groups of stations in Seattle.
One is located in the University district, while the other is located downtown and in its surroundings for example around Capitol Hill.
Now that we know where the single stations are based, let’s have a look at the trips data in order to understand how the single trips can be linked to actual movements throughout Seattle.
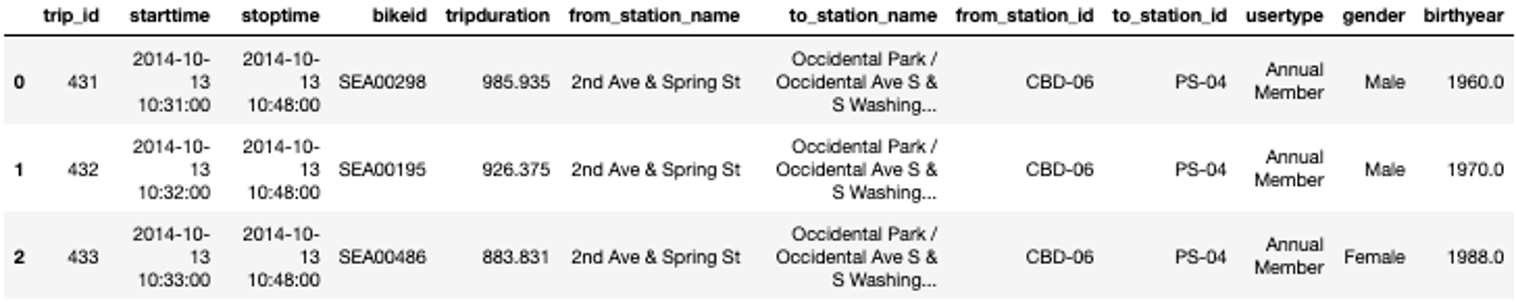
Even though the trip data is anonymized, still quite some information is given. For each trip, given by a unique “trip id”, we know when and from where the trip started and where and when the bike was returned. The resulting trip duration is given in seconds. Further, every bike in use has a unique “bike id” such that we can also follow a single bike. Additionally, we learn something about the single bike users. We know whether it either was an Annual Member having a ride or a Short-Term Pass Holder with a ticket for 1 or 3 days. On top of that, the gender and year of birth of the bike user is shared.
In order to make it possible to also place the single trips on a map later-on, we merge the geographical information namely latitude, longitude, and elevation from the stations with the information of the single trips.
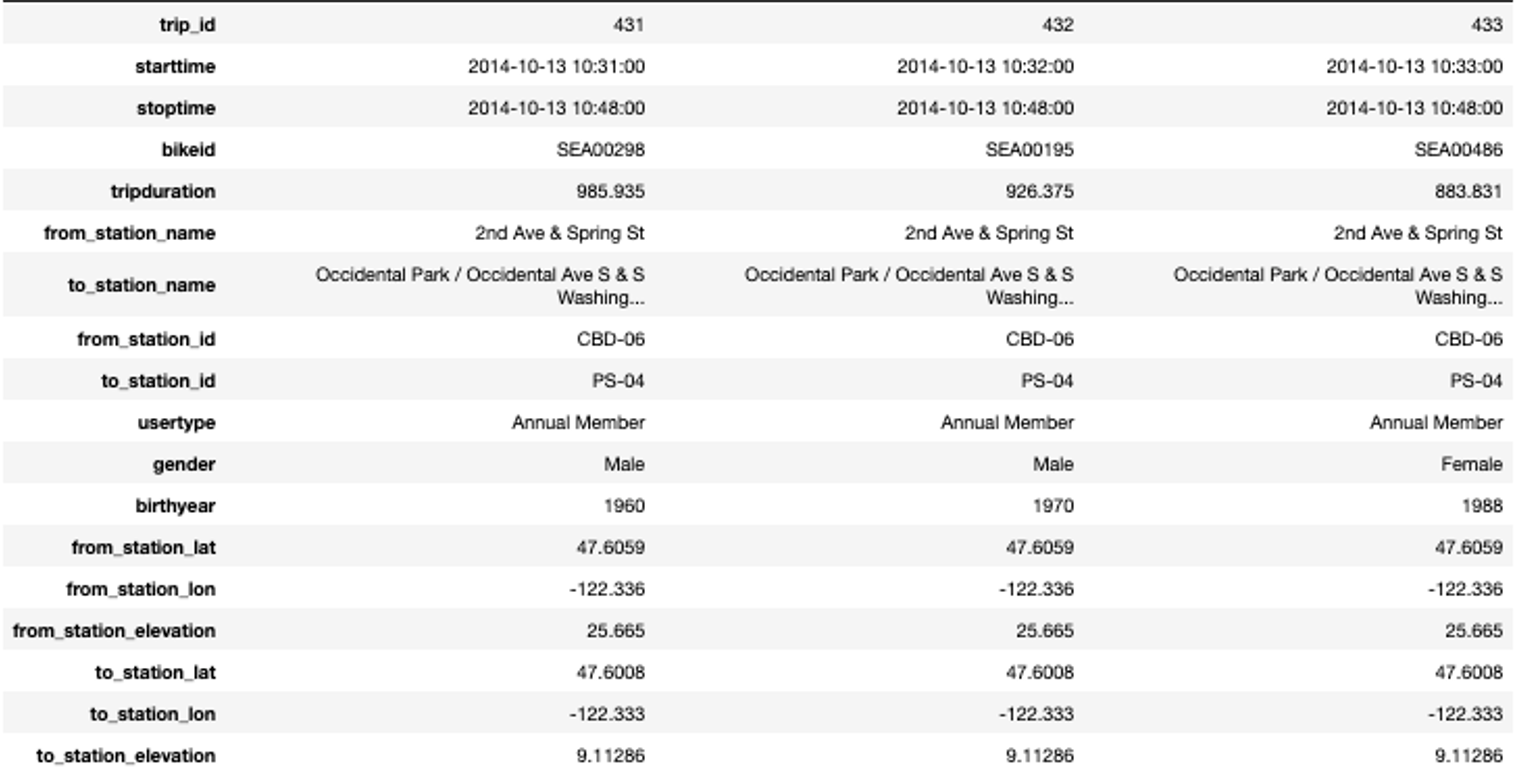
Note that we need to execute two merge commands: A first one for the departure station and a second one for the arrival station. An excerpt of the merged data that we will use in the rest of this Starter Kit is shown in the table on the right. For reasons of readability, we show the data here in a transposed manner such that each column provides the information for one single trip.
Before proceeding with the further exploration, we first check the completeness of the data, hence where we observe missing values.
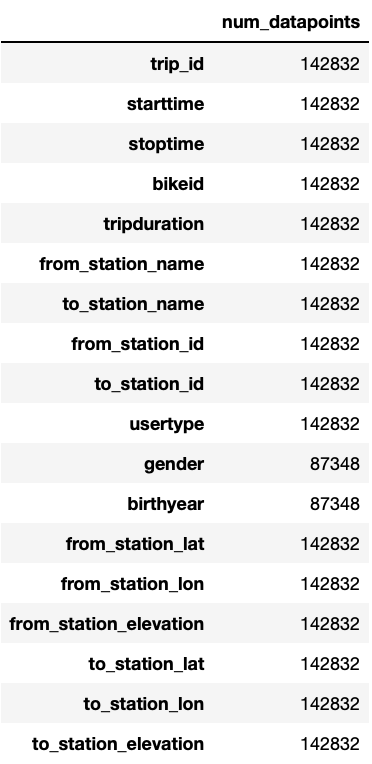
We can see that at most more than 140,000 entries are given. Most variables seem to be complete, except gender and birthyear, which only contain about 87,000 entries. The reason for this is that Short-Term Pass Holders do not need to specify their age and gender, due to which this information is just missing in the data. This can be confirmed by calculating the percentage of data present for these two variables for the single user types.
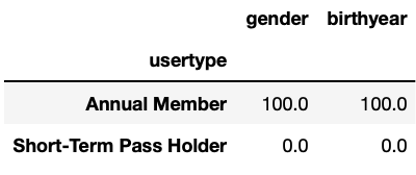
While for all Annual Members, gender and birthyear are given, it is not known for any of the Short-Term Pass Holders. For our later analysis we want to replace the missing values with meaningful entries. In order to see how to replace them, we first have a look at the existing values.
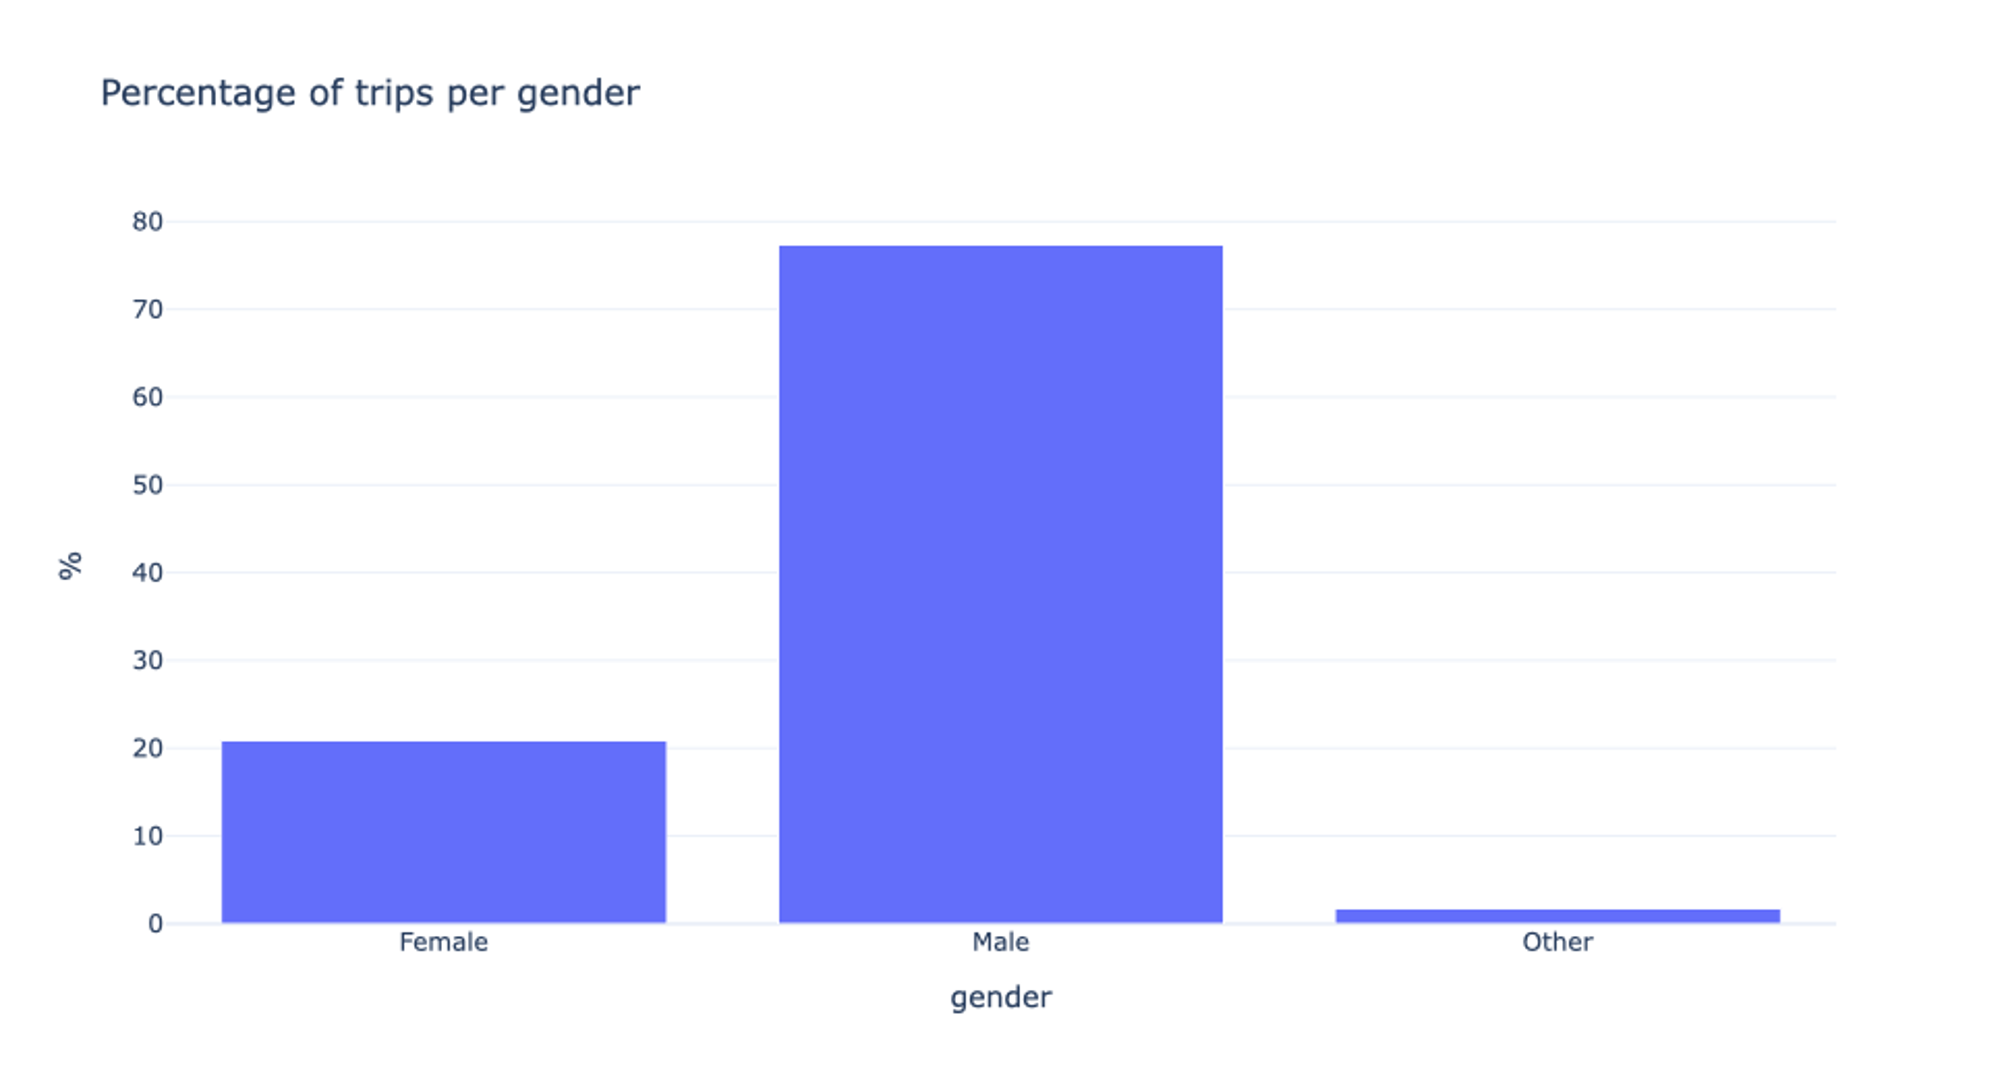
For the Annual Pass Members, three different gender options are available: Female, Male, and Other. In order to be able to distinguish the missing values from the remaining ones later-on, we replace them by “Unknown”. Interesting is the fact that almost 80% of all users are male. We will get back to this in the following video.
In order to further prepare the data for subsequent analysis, we perform the following actions: First, we convert the variable tripduration which is currently given as a float variable, to a datetime.timedelta object and store it as new variable tripdurationTimeDelta. Further, we add a new variable tripdurationMinutes indicating the duration of a trip in minutes which we keep as a float value.
For further analysis, it can be convenient to work with age instead of year of birth. Therefore, we convert the variable birthyear to an integer and create a new variable age. Finally, we extract from the starttime variable the month, the day of the week and the hour of the day, and use the starttime variable to index the data.
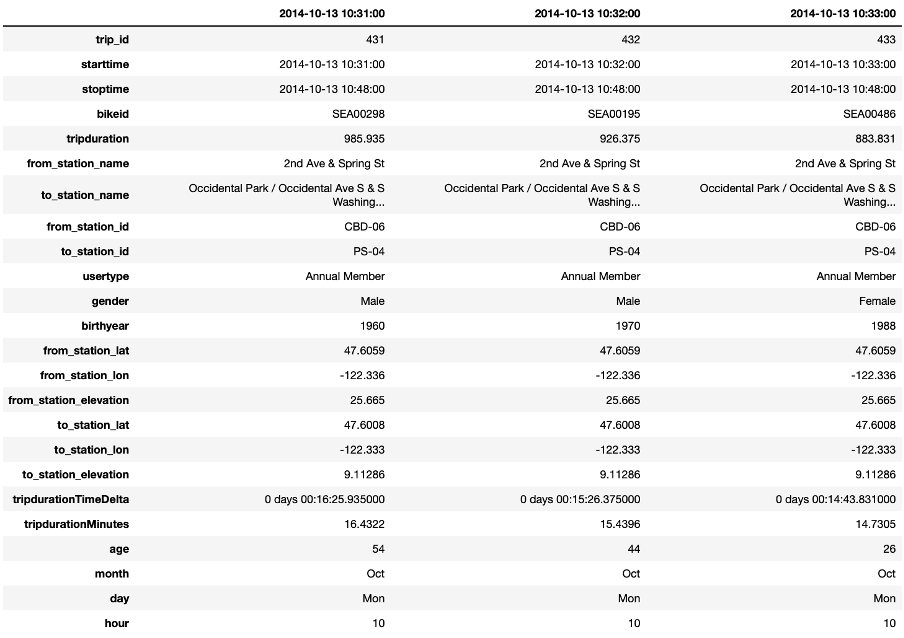
The table presents an excerpt of the dataset after these transformations. Note that also here, each column indicates one trip.
With this well-prepared dataset, we can start the actual data exploration in the next video.
Authors: EluciDATA Lab
Permanent URL